| Term | Description | Example Graph |
|---|
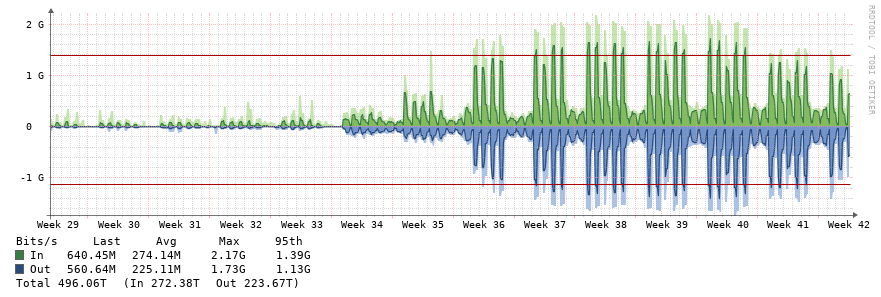
| bps | Bits per second - Red line indicates 95th Percentile
- Dark green / Dark blue areas indicate average bps over a time period
- Note that graph data is summarized as it ages, so older graph data will be less precise than newer graph data
- Light Green / Light blue areas indicate maximum bps during a time period
- Total (bottom left): approximate total traffic transferred during the timeframe selected, both directions
- In/Out: total per direction
| |
| pps | Packets per Second | 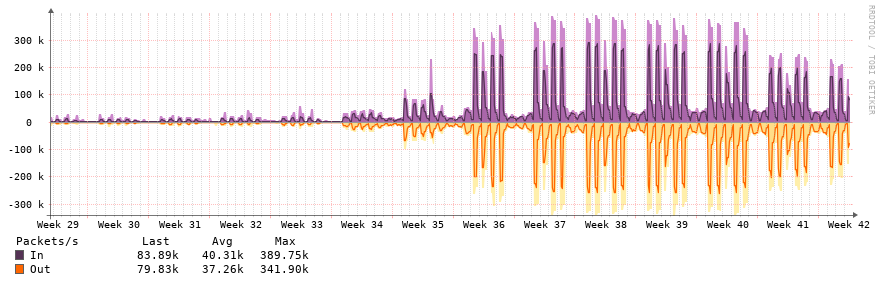 |
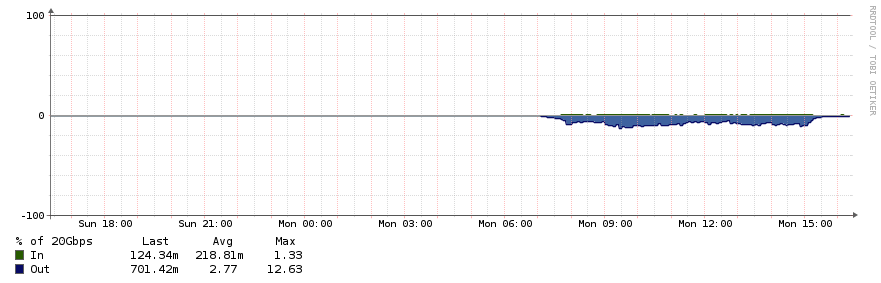
| Utilization | Percentage utilization of circuit. | |
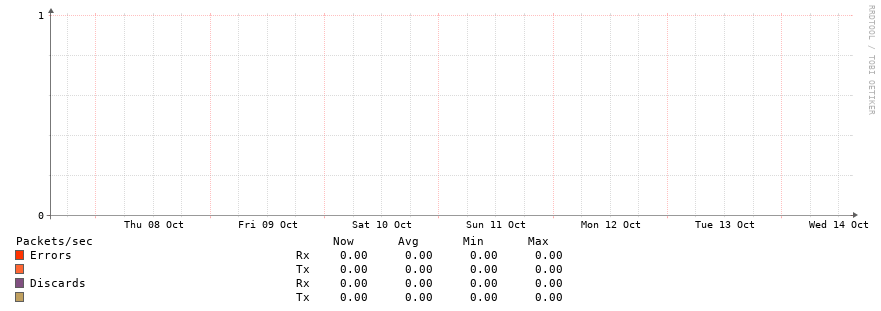
| Errors | Number of ethernet or CRC errors on the link. Ideally this should be zero and the graph should be pretty boring. If you see errors, contact support to troubleshoot. | |
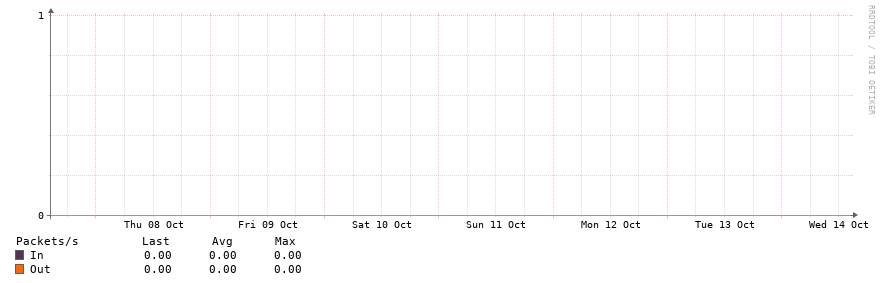
| Discards | Number of discards on an interface. Discards may occur if a link is saturated | |