...
| Term | Description | Example Graph |
|---|---|---|
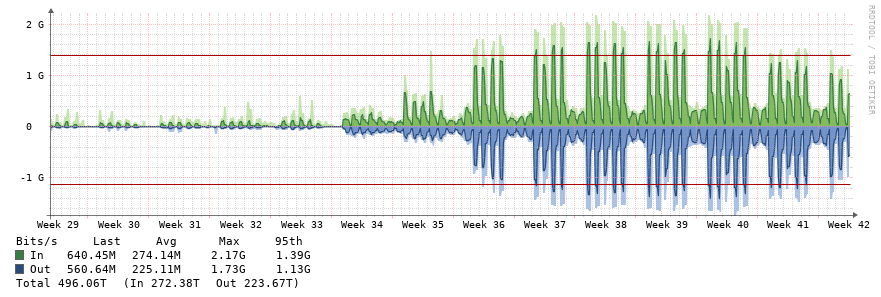
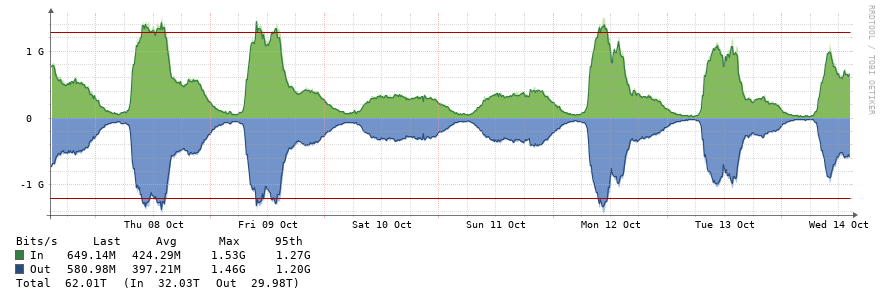
| bps | Bits per second.
|
|
| pps | Packets per Second | 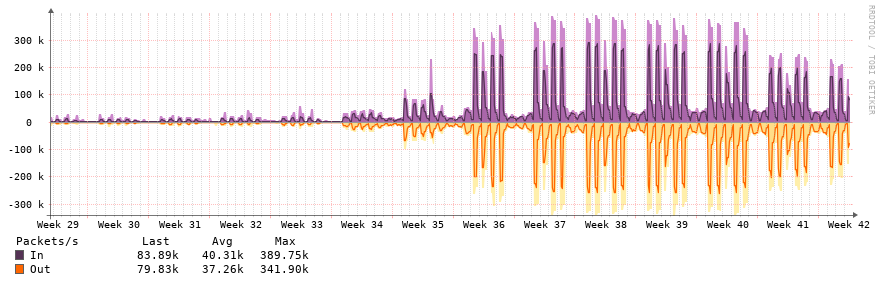 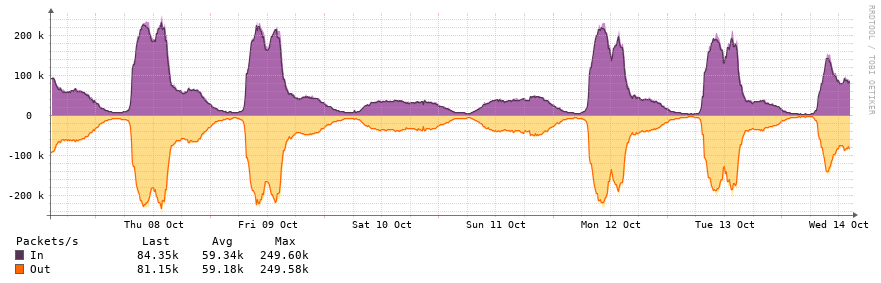 |
| Errors | Number of ethernet or CRC errors on the link. Ideally this should be zero and the graph should be pretty boring. If you see errors, contact support to troubleshoot. |
|
| Discards | Number of discards on an interface. Discards typically occur when a link is saturated |
|
...