...
| Table of Content Zone | |
|---|---|
|
As of April 2018, the NRG graphs have been deprecated. You can find your new bandwidth graph at graphs.wiscnet.net.
Why are we doing this? There are several reasons, some of which are internal, but mostly these graphs are faster, contain more information, and don't look like they came from the 90s. (No offense to the Discman, beepers, N64, or AOL screen names.)
We'll keep NRG graphs up and running through the middle of May 2018, after which they will automatically redirect to the new graphs.
Searching
Search for your Member Organization name. Use shorter sections of text, such as "Abbotsford" or "Wrightstown". If you have any issues finding your graphs, please reach out to support@wiscnet.net.
...
| Term | Description |
|---|---|
| Member Organization | Name of organization |
| Device A / Z | Hostname of the WiscNet devices on either side of your uplink |
| Interface A / Z | Router interface names |
| Bandwidth | Capacity of link in mbps |
| Site Code | Code used to help correlate graphs to Member Organization |
| Transport Provider | Who you may be using as a transport provider |
| Transport Provider ID A / Z | Circuit ID from the transport provider |
| WiscNet Circuit ID | Internal WiscNet identifier for your circuit |
Circuit Graphs
| Term | Description | Example Graph |
|---|---|---|
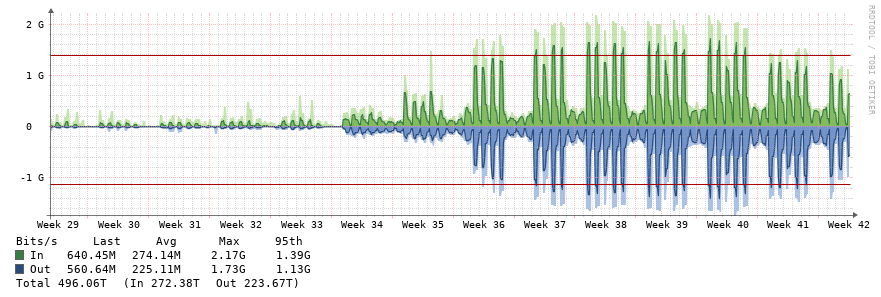
| bps | Bits per second
|
|
| pps | Packets per Second | 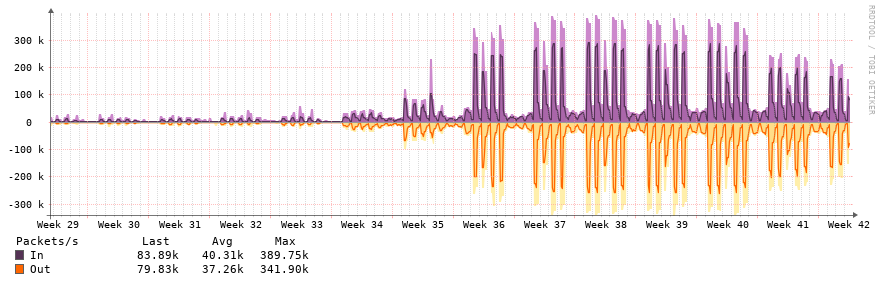 |
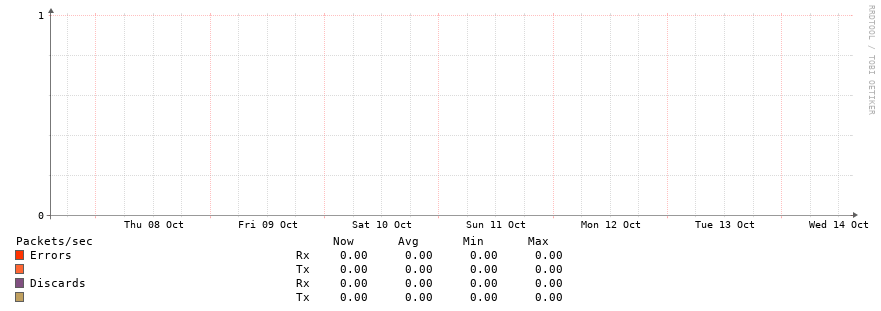
| Errors | Number of ethernet or CRC errors on the link. Ideally this should be zero and the graph should be pretty boring. If you see errors, contact support to troubleshoot. |
|
| Discards | Number of discards on an interface. Discards typically may occur when if a link is saturated |
|
Device Graphs
...