...
| Table of Content Zone | |
|---|---|
|
As of April 2018, the NRG graphs have been updated. You can find your new bandwidth graph at graphs.wiscnet.net.
Why are we doing this? There are several reasons, some of which are internal, but mostly these graphs are faster, contain more information, and don't look like they came from the 90s. (No offense to the Discman, beepers, N64, or AOL screen names.)
...
| Info |
|---|
If you'd like help analyzing your graphs, contact WiscNet Support (support@wiscnet.net or 608-442-6761, opt 2). If you feel you need an upgrade, contact WiscNet Member Success (membersuccess@wiscnet.net). |
Searching
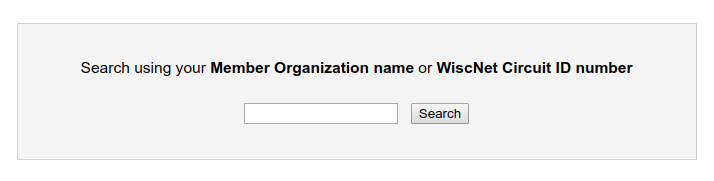
Search for your Member Organization name. Use shorter sections of text, such as "Abbotsford" / "Abbots" or "Wrightstown" / "Wright".
Terminology
Circuit Info
| Term | Description |
|---|---|
| Member Organization | Name of organization |
| Device A / Z | Hostname of the WiscNet devices on either side of your uplink |
| Interface A / Z | Router interface names |
| Bandwidth | Capacity of link in mbps |
| Site Code | Code used to help correlate graphs to Member Organization |
| Transport Provider | Who you may be using as a transport provider |
| Transport Provider ID A / Z | Circuit ID from the transport provider |
| WiscNet Circuit ID | Internal WiscNet identifier for your circuit |
| TEACH ID | Identifier if circuit provided by Teach Network |
| Hub | WiscNet Backbone aggregation device at a Pop |
| CPE | Customer Premise Equipment on site. See WiscNet Managed Device (CPE) |
Circuit Graphs
Graphs are displayed from the Hub (pop) side as well as the CPE (member) side, should a CPE exist.
Units are in International System of Units (G = giga M = mega, m = milli..)
| Term | Description | Example Graph |
|---|
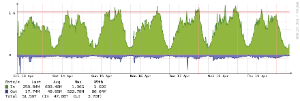
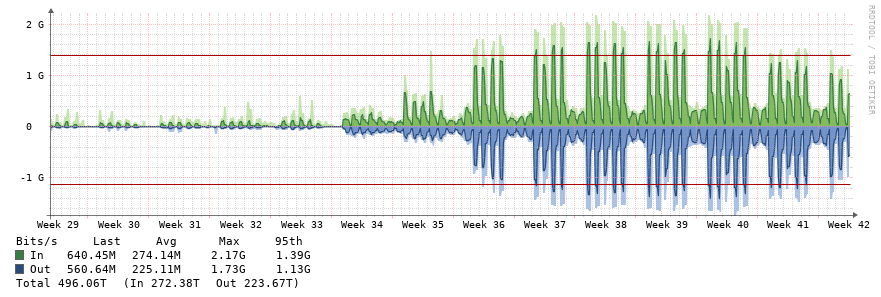
| bps | Bits per second
|
|
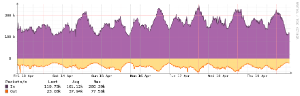
| pps | Packets per Second | 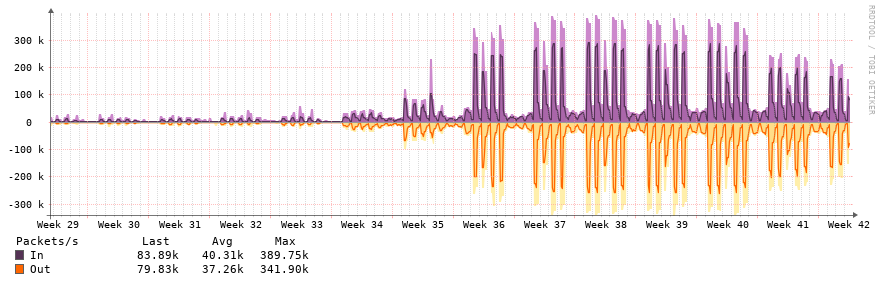 |
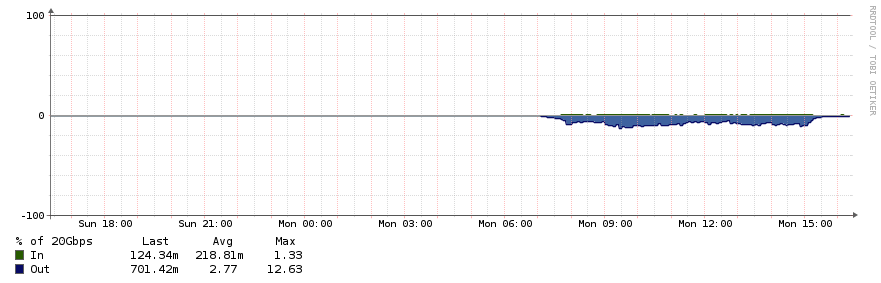
| Utilization |
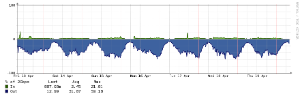
| Percentage utilization of |
| circuit. |
|
| Errors |

| Number of ethernet or CRC errors on the link. Ideally this should be zero and the graph should be pretty boring. If you see errors, contact support to troubleshoot. |
|
| Discards |
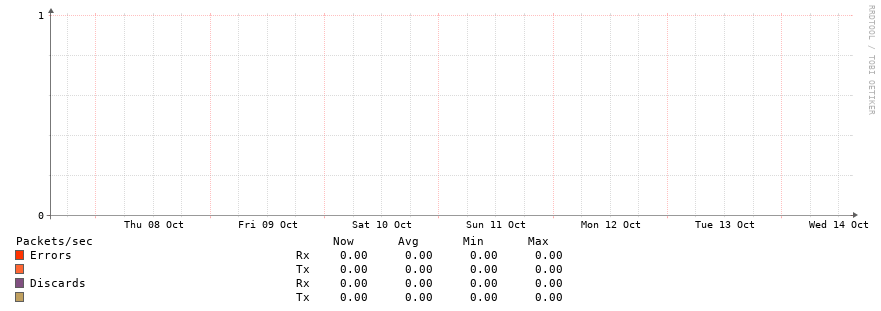

| Number of discards on an interface. Discards |
| may occur |
| if a link is saturated |
|
Device Graphs
These are sensors and indicators on your WiscNet Managed Device (CPE). These graphs will not be visible if you do not have a WiscNet-managed device.
| Term | Description | Example Graph |
|---|
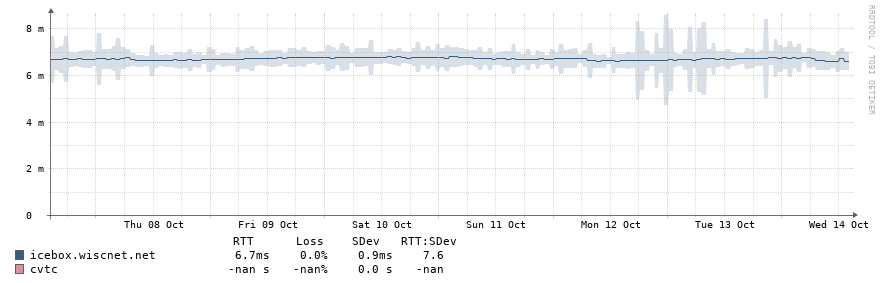
| Ping Response Time |
| Time in milliseconds it took our monitoring server to ping WiscNet router on premise. Ping is currently sourcing from Eau Claire, WI. |
|
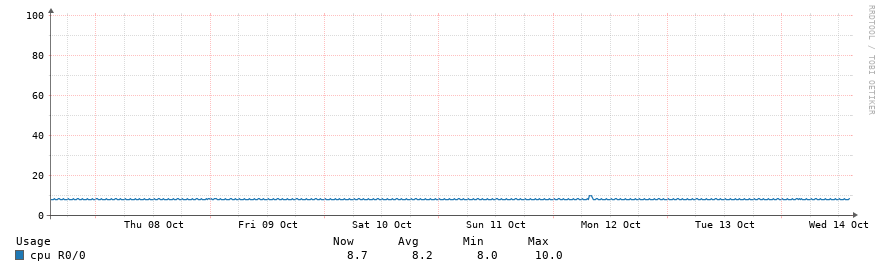
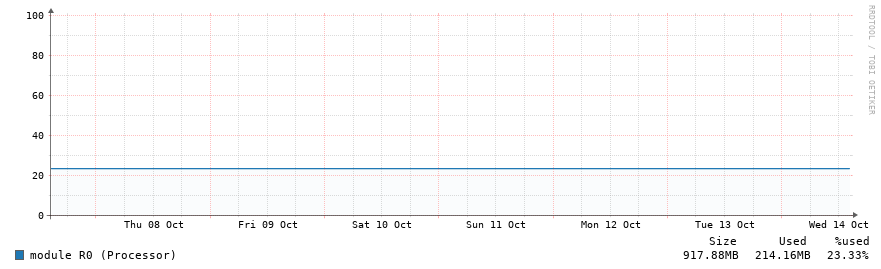
| CPU |
| Processor utilization of device |
| |
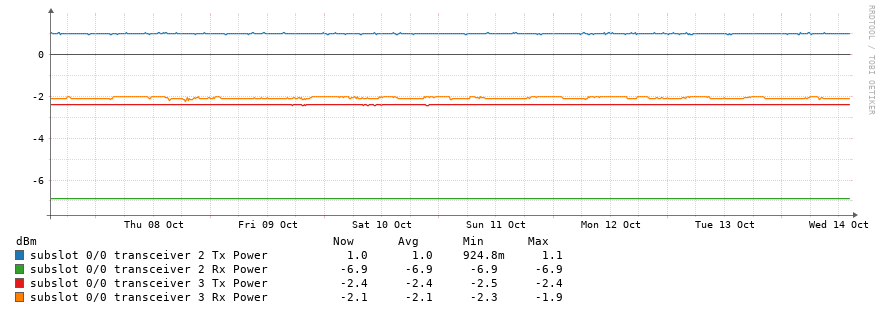
| Optical Monitoring (DOM) | Shows light levels received on fiber optic connections |
|
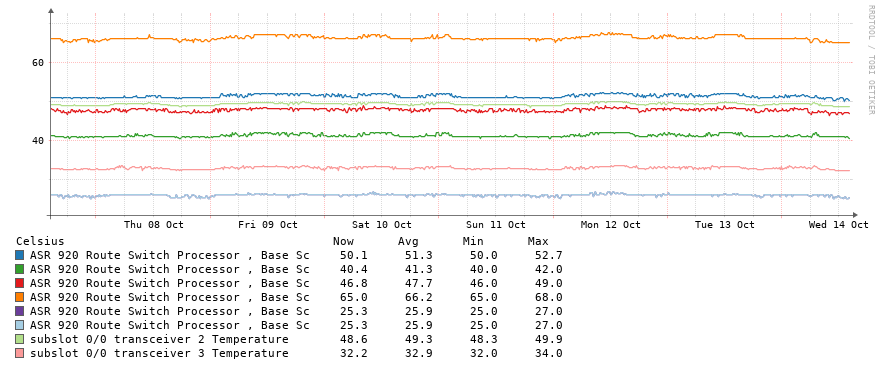
| Temperature |
| Internal temperature of device. Some models will have multiple sensors. Y axis changes dynamically. |
|
| Memory |
| Memory utilization of WiscNet router. Some devices may display multiple readings depending on memory pool |
| |
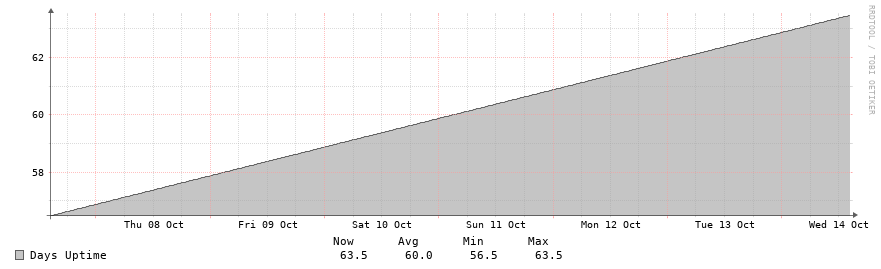
| Uptime |
| Length of time in days since WiscNet router has last rebooted. Always up and to the right. Read the legend to get the time in days |
| . |
| |
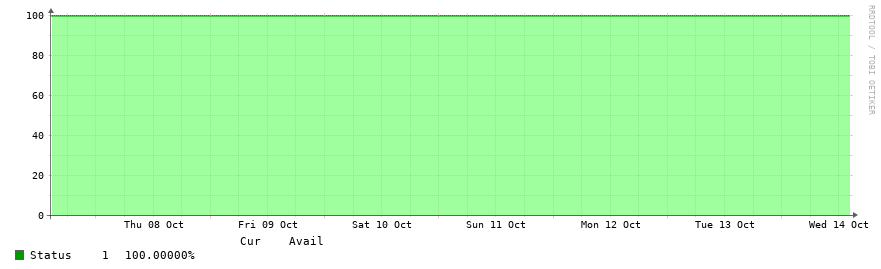
| Status | Status of device over time, calculated as percent. |
|
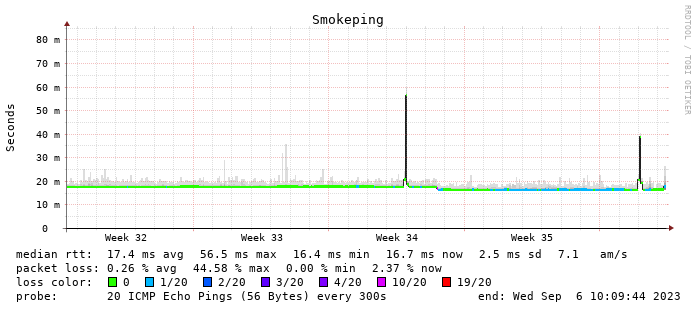
| Packet Loss | Indication of Latency and Packet loss to the WiscNet CPE. Green is no loss, Blue to Red indicates loss Official Smokeping documentation contains further detail |
|
Changelog History
- - Search results now display as table instead of list. Added TEACH ID where applicable
- - Added Packet Loss graph
- - Added Network Diagram, Bandwidth Utilization Percent, Upload/Download colour coding, disable 95th% line
- - Added CPE network graphs
- - Fixes for Mobile view
- - Clarify CPE interface names with 'Port'
- - Initial release of graphs.wiscnet.net. Replaced nrg.wiscnet.net.