...
| Term | Example Graph | Description |
|---|---|---|
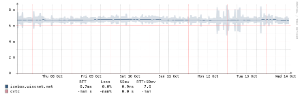
| bps |
| Bits per second |
| pps |
| Packets per Second |
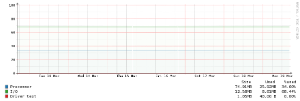
| Utilization |
| Percentage of connection used |
| Errors |
| Number of ethernet or CRC errors on the link. Ideally this should be zero and the graph should be pretty boring. If you see errors, contact support to troubleshoot. |
| Discards |
| Number of discards on an interface. Discards typically occur when a link is saturated |


Device
| Term | Example Graph | Description |
|---|---|---|
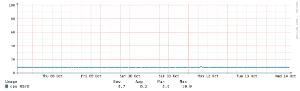
| Ping Response Time |
| Time in milliseconds it took our monitoring server to ping WiscNet router on premise. Ping is currently sourcing from Eau Claire, WI. |
| CPU |
| Processor utilization of device |
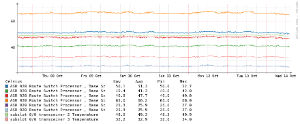
| Temperature |
| Internal temperature of WiscNet router on premise. Some models will have multiple sensors. Y axis changes dynamically. |
| Memory |
| Memory utilization of WiscNet router. Some devices may display multiple readings depending on memory pool |
| Uptime | 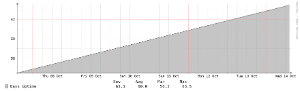 | Length of time in days since WiscNet router has last rebooted. Always up and to the right. Read the legend to get the time in days. Older devices show this value reset every 497 days due a limitation of SNMP. |