...
| Term | Example Graph | Description |
|---|---|---|
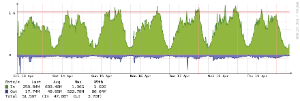
| bps |
| Bits per second. Red line indicates 95th Percentile |
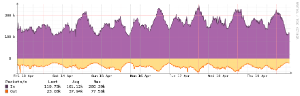
| pps |
| Packets per Second |
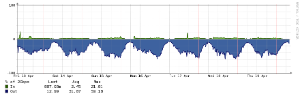
| Utilization |
| Percentage of connection used. If you have a 1Gbps connection that is using 100Mbps, this should show approximately 1/10th full. |
| Errors |
| Number of ethernet or CRC errors on the link. Ideally this should be zero and the graph should be pretty boring. If you see errors, contact support to troubleshoot. |
| Discards |
| Number of discards on an interface. Discards typically occur when a link is saturated |


...